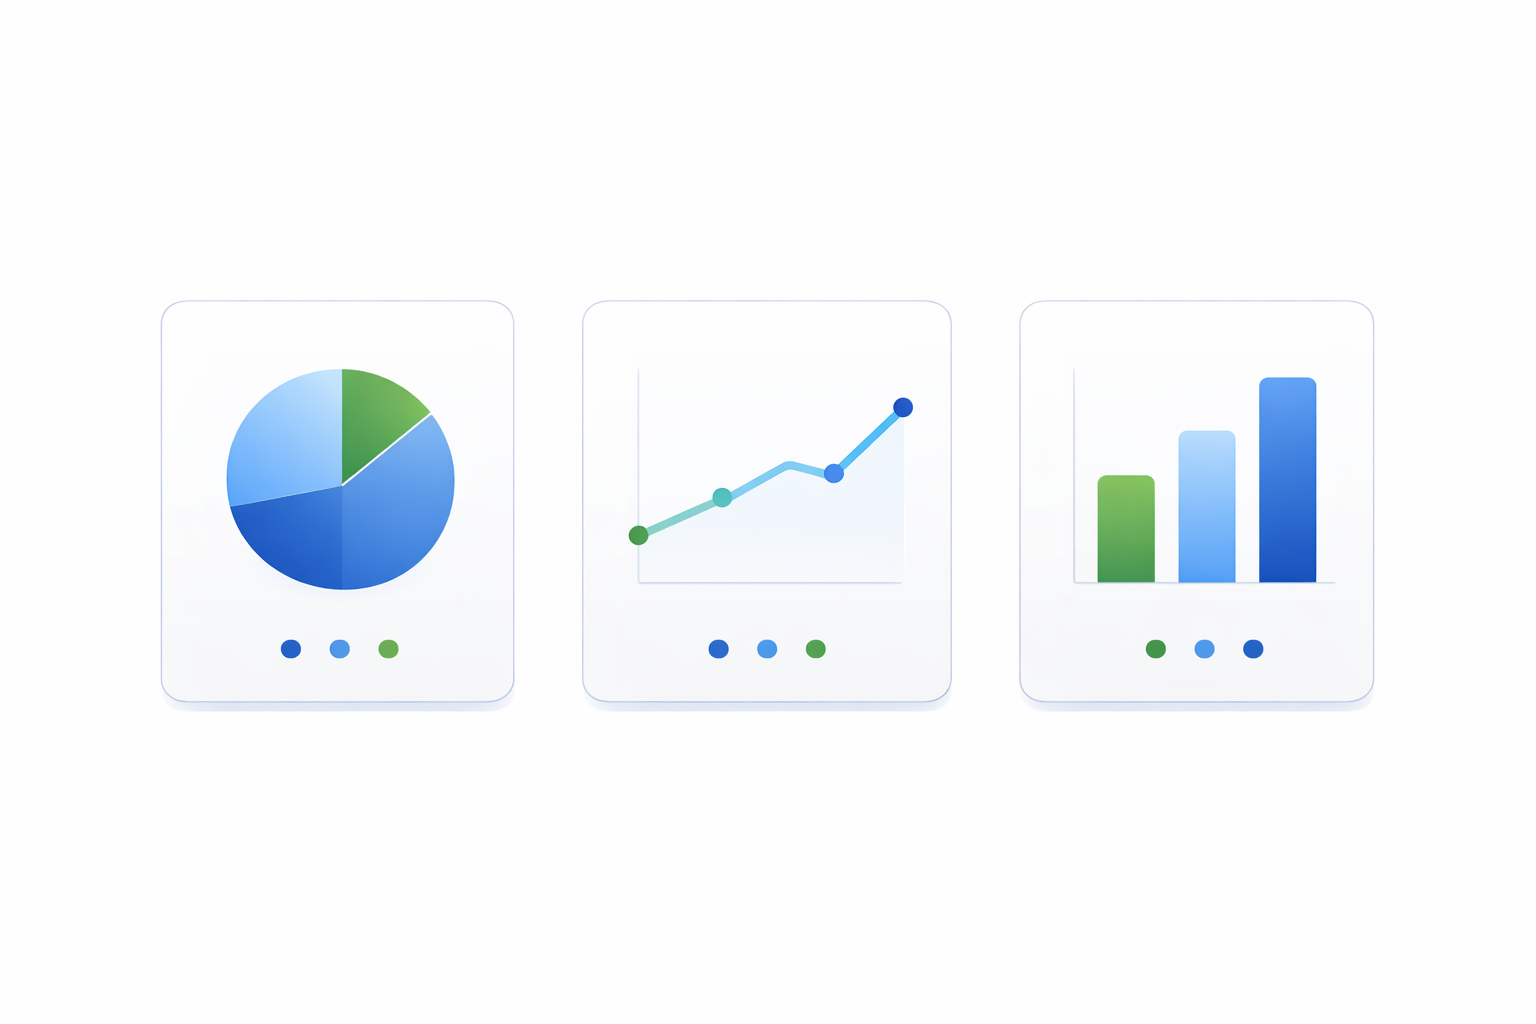
Visual Charts
Beautiful pie charts and bar graphs for easy understanding.
 Cazhoo
Understand your spending with visual insights.
Analytics and reports convert raw transactions into trends, comparisons, and exportable summaries so you can make data-backed finance decisions.
Transform your financial data into actionable insights. View spending trends over time, compare categories, and generate detailed reports. Our visual charts make it easy to understand where your money goes, helping you make better financial decisions.
Analytics and reports convert raw transactions into trends, comparisons, and exportable summaries so you can make data-backed finance decisions.
Each benefit is designed to reduce manual work, improve clarity, and help you make faster financial decisions.
Beautiful pie charts and bar graphs for easy understanding.
See how your spending changes over time.
Download reports for your personal records.
Detailed view of spending by category.
Cazhoo organizes every income and expense entry in a unified timeline.
Charts reveal where money goes and how your habits shift over time.
Generate clean reports for records, planning meetings, or audits.
A quick side-by-side view of what changes when this workflow is managed with Cazhoo.
| Metric | With Cazhoo | Without Cazhoo |
|---|---|---|
| Setup Time | Start using Analytics & Reports in minutes with guided setup. | Manual setup across notes or spreadsheets takes longer and is easy to miss. |
| Daily Workflow | Structured flow with fewer clicks and cleaner records. | Repetitive manual updates create inconsistency and fatigue. |
| Data Visibility | Real-time visibility and clear status from one dashboard. | Fragmented tracking makes context and history hard to follow. |
| Decision Quality | Actionable insights help improve spending and planning decisions. | Limited insights make corrective action delayed or inaccurate. |
Comparing category spend month-over-month
Exporting financial reports for audits and planning
Detecting seasonal spikes and recurring costs quickly
Yes, reports can be exported for records and external analysis.
Yes, analytics refresh with your latest transaction data.
You can review short and long date ranges based on your planning needs.
Start for free and use Cazhoo to simplify your everyday finance management from day one.